KPI Demo
What does KPIDemo do?
The KPIDemo feature calculates a set of Key Performance Indicators (KPIs) of vibration measurements. The calculated KPIs are
RMS - Estimate of vibration amplitude
Peak - Maximum acceleration value
Peak to peak - Difference between maximum and minimum acceleration value
Variance - Variance of the vibration
Crest factor - Ratio of the peak value of the waveform to its RMS value
Utilization - Boolean value if vibration RMS is above a given utilization threshold, default to 0.1
DC component - Estimated value for the DC bias of the signal
Use cases for the feature
Determining trends in the vibration level over time. An increasing trend may indicate a developing failure.
Comparing similar assets in terms of their RMS (or other KPI) value.
High level visualization of vibration measurements.
How the KPIs work
Each KPI attempts to summarize some behaviour of the vibration measurement into a single number. Below are the formulas for each of the KPIs where \(x \in \mathbb{R}^n\) is the vibration measurement vector.
RMS
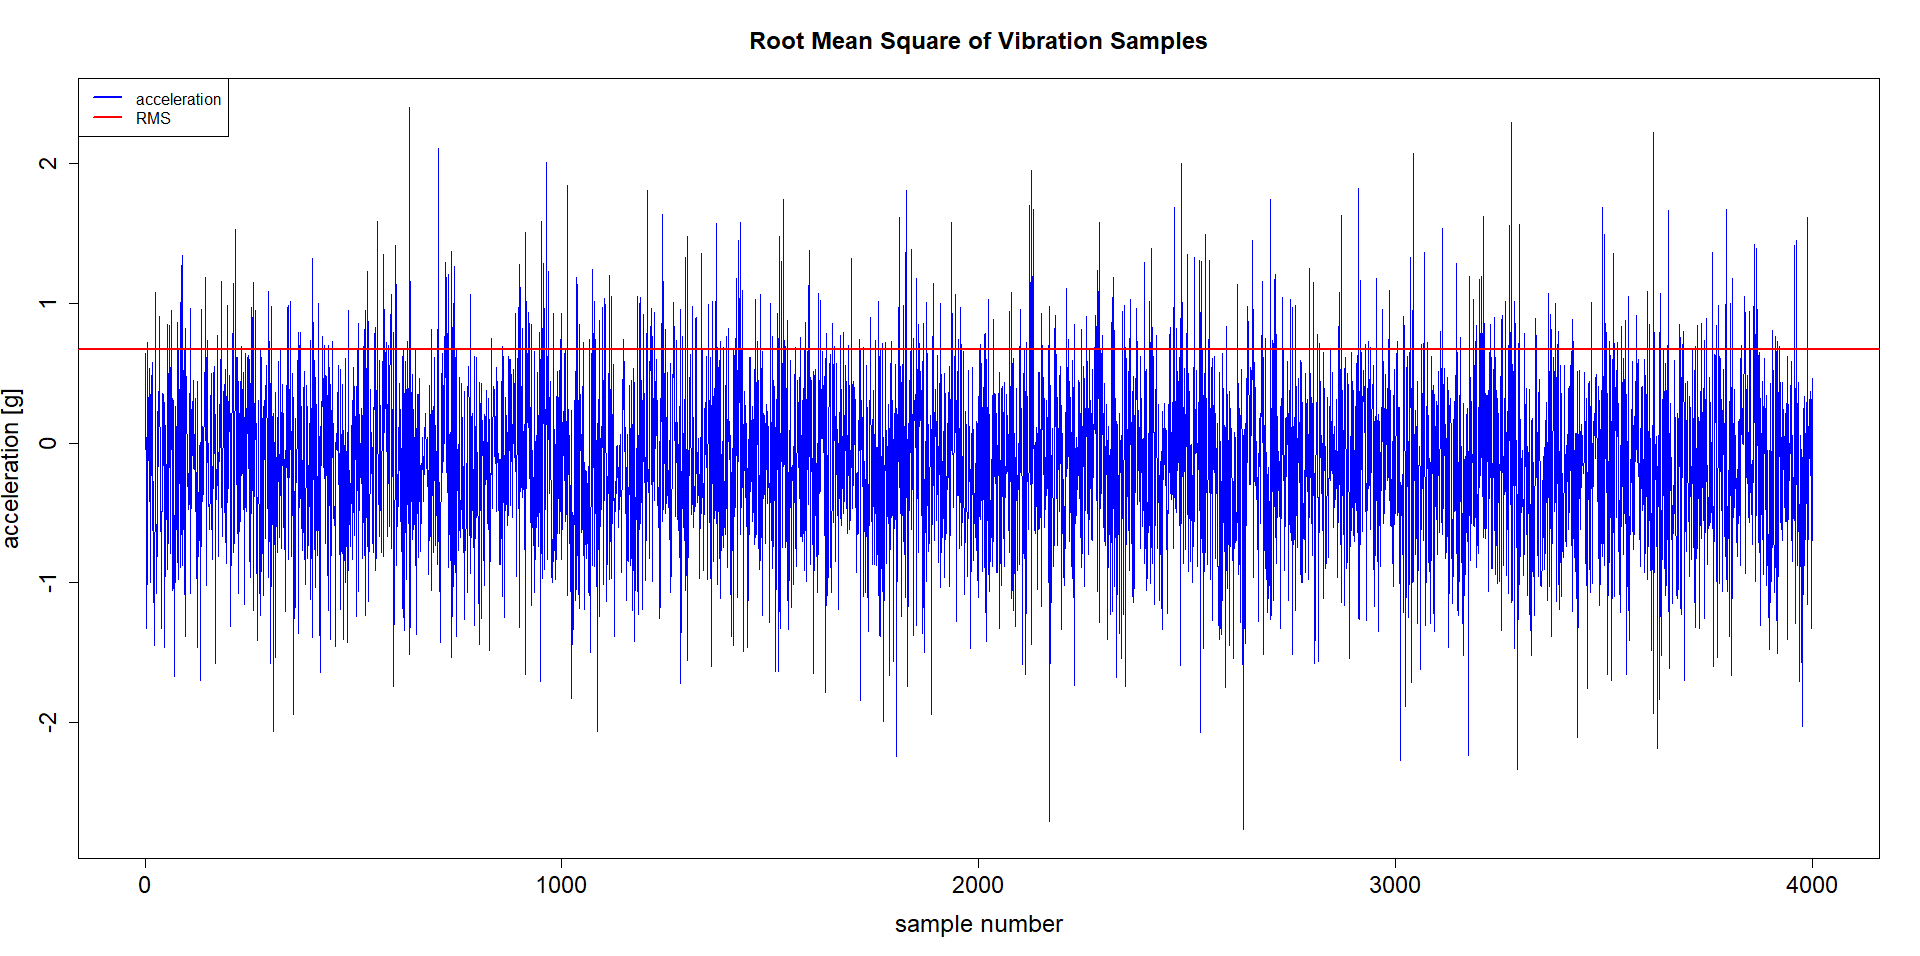
The most common KPI is the Root Mean Square (RMS) of the measurement.
The plot below shows a series of acceleration samples and the calculated RMS.
Peak
The peak is the maximum value from a measurement.
Peak to peak
The peak to peak is the difference between the maximum and the minimum value in the measurement.
Variance
The statistical variance of the measurement values.
Where \(n\) is the number of samples in the measurement and \(\mu\) is the average measurement value.
Crest factor
Utilization
Where \(t\) is the utilization threshold and \(\theta\) is the heaviside step function.
DC component
The DC bias of the signal is estimated as the mean value of the signal.
Using the algorithm via mvg
Upload vibration time series data to a source.
Request a KPIDemo analysis for the source.
Read the results(see below).
Analysis Parameters
The KPIDemo feature requires no parameters apart from sourceId (sid).
Structure of the Results
The result returned by the analysis call will be a dictionary containing eight lists:
{
    'timestamps': [... list of timestamps ...],
    'rms': {"channel": [... list of floats ...]},
    'peak': {"channel": [... list of floats ...]},
    'peak2peak': {"channel": [... list of floats ...]},
    'variance': {"channel": [... list of floats ...]},
    'crest_factor': {"channel": [... list of floats ...]},
    'utilization': {"channel": [... list of ints ...]},
    'dc_component': {"channel": [... list of floats ...]},
}
Notes
The feature is agnostic to the scale of the measurements, but the scale for all measurements needs to be consistent.
The measurements are trimmed of DC offset.
Neither of the KPIs are selective of frequency bands.